Traders Exchange


Home

About Us

Trading Platform

Contact Us

Request Info

Basic Forex Course

BostonWhalersChainsaw

Forex Trading

Why Trade Forex

Trading Basics

Order Types

Margin Policy

Forex vs. Futures

Futures Trading

Commodity Quotes

Stock Trading

Research

Economic Calendar

Forex News

The Smith Report FX

Forex Links

Home and Energy

OutdoorFurnace

WaterTreatment

Resources

Currency Guide

Glossary

Weekend Orders

Tom. Next Proc.

World News

Sports Information

Golf

Football

BaseBall

Hockey

Fishing

Technical Analsys

CandleSticks

Point and Figure

Overlays

Indicators/Oscillators

Fundamental Analysis

Technical Indicators

World Class Provider Of Foreign Exchange Trading Services

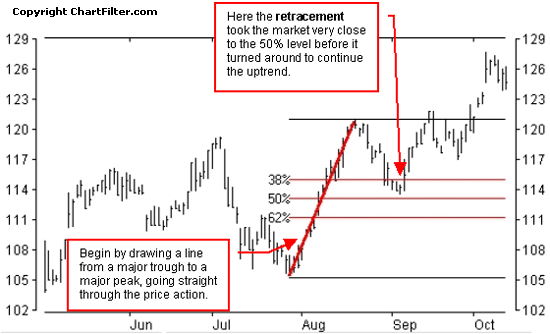
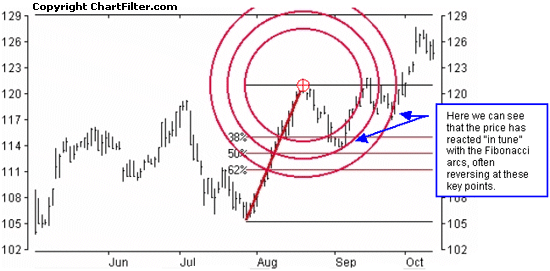
Fibonacci arcs & retracements

Fibonacci arcs & retracements help anticipate support and resistance levels along with price targets.

Overview

After making long sustained moves in one direction, many markets retrace a part of the move before continuing on further. The Fibonacci indicator, popularized by Ralph Nelson Elliot, is used to try and forecast potential support levels and price targets, based on the height of the overall move and any wave patterns.

For example, if a stock increased from $5 to $10 and then slipped back 50%, this retracement would take it to $7.50 before it continued upwards again.

This indicator uses mathematical ratios discovered by Leonardo Fibonacci's in the 12th century. The Fibonacci summation series is 1, 1, 2, 3, 5, 8, 13, 21, 34, 55, 89, 144… and so on to infinity. Interestingly, these numbers have the following constant relationships:

  • The sum of any two consecutive numbers equals the next higher number.
  • The ratio between any number and the next higher number approaches 0.618 after the first four calculations.
  • The ratio between any number and the next lower number is approximately 1.618 (the inverse of 0.618).

The number 1.618 is commonly referred to as the Golden Mean or the Golden Section. The real value of this number series is that it is "the most important mathematical presentation of natural phenomena ever discovered" (R. Fischer). It keeps popping up in everything from the proportions of the Egyptian pyramids… the number of florets in flower heads…the double helix of the DNA molecule… to the logarithmic spiral of the nautilus shell.

(The well-known Elliot Wave Principle is also based on the application of Fibonacci numbers to the waves evident in any price chart.)

Interpretation

The most commonly used numbers in this analysis are 61.8% (usually rounded off to 62%), 38% and 50%. This means that, in a strong trend, the minimum retracement is usually close to the 38% level and may go as far as the 62% level.

Constance Brown, a well known technical analyst, has written, "If the market has shown respect in the past to a Fibonacci grid drawn on the chart, the chances are much higher that it will also respect those levels in the future market action."


Fibonacci Retracements

  • Fibonacci Retracements are based on a trendline drawn between a significant trough and peak.
  • If the trend is rising, the retracement lines will descend from 100% to 0%
  • If the trendline is falling, the retracement lines will ascend from 0% to 100%
  • Horizontal lines are drawn at the common Fibonacci levels of 38%, 50%, & 62%
  • As the price retraces, support and resistance often occur at or near the Fibonacci Retracement levels.

Fibonacci Arcs

Fibonacci arcs can be added to the same chart, or they can be charted alone. The arcs are drawn centered on the last peak or trough, crossing the original trendline at the points where the retracement lines intersect. The price will tend to "react" to both the arcs and the retracement levels, as they provide support and resistance.


Price Targets

More advanced studies can also be undertaken, based on the Fibonacci numbers, to develop price targets. One such approach is to add a second copy of the original Fibonacci grid above or below the first (depending on which way the market is trending). This will give you potential price targets based on adding a new set of 38%, 50% and 62% lines.


Back to Overlays, Bands and Moving Averages Main
 

No warranties are given by Traders Exchange Corp. and no warranties are implied regarding the content of the suggested reading material or the content of the website(s) which can be accessed through this website. Traders Exchange Corp. shall not be liable in any way for losses or liability of any kind to any person resulting directly or indirectly through the use in any way by such person of the information referred to and/or use of the suggested reading material or the website(s), however such loss or liability occurs, and whether financial or otherwise. The pages and the opinions or information contained in the suggested reading material or these website(s) are the creation of outside parties and do not necessarily reflect the opinions or representations of Traders Exchange Corp.


Education provided by ChartFilter.com

© 2006 MHP Systems Inc. / ChartFilter.com