World Class Provider Of Foreign Exchange Trading Services
Candlestick Patterns
Overview
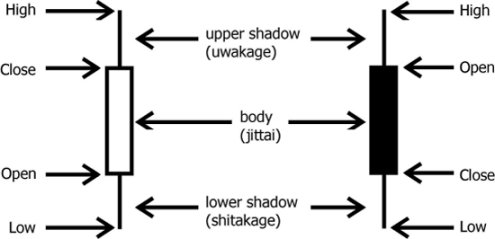
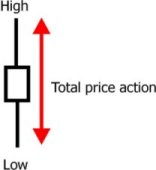
Candlestick charting has been in use in Japan for the last 300 years and has received world wide recognition. Each candlestick is composed of four values, the high, low, open and close. The advantage to this form of charting is that it provides more visual information about the trading day as well as many trading signals to help decision making.
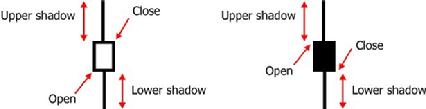
The body of the candlestick (or jittai) is the open and the close of the trading day. The high and the low of the day create the upper and lower shadows of the main candle body.
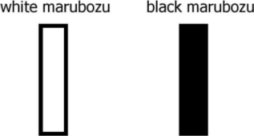
A marabozu, or "shaved head", is a candlestick with no shadows. This is where the open and close prices are similar to the high and low.
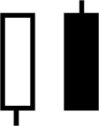
An opening bozu in a white candlestick is when there is no lower shadow (opens at the low) and in the case of the black candlestick an opening bozu has no upper shadow (opens at the high).
A closing bozo in a white candlestick is when there is no upper shadow (it closes at the high) and in a black candle a closing buzo is when there is no lower shadow (it closes at the low).
Doji
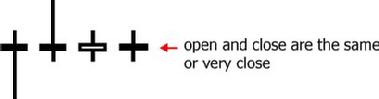
A Doji candlestick is one of the more common candlesticks. The Doji signifies a balance of buyers and sellers and shows an indecisiveness in the price. Doji's are not very significant by themselves, but if a Doji occurs after a large candle a stronger signal is generated (see bullish and bearish patterns).
Size of Candles
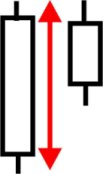
The size of the candlestick gives the trader an indication of buying (white candle) or selling (black candle) pressure. The larger the candle, the more buying and selling pressure, short candlesticks on the other hand represent a period of consolidation and weak buying or selling pressure
Size of Shadows
Upper shadows represent buyer action which pushes the price up. Lower shadows represent seller action which pushes the price down.
The size of the shadows tells us the amount of price action that occured during the day as well as the activity of buyers and sellers.
Short shadows show a balance of buyers and sellers (a consolidation).
If both shadows are short (as well as the candle), this represents a weak trading day where prices had little movement. This shows a balance of sellers and buyers. If there is low volume with a short small candle, this shows a weak market day.
Candles with a long upper shadows and a small lower shadow represents a trading day were the buyers forced the price up during the trading day but sellers later won.
Candles with long lower shadows and small upper shadows signifies that the sellers dominated the opening while the buyers pushed the price up at the end of the session.
No warranties are given by Traders Exchange Corp. and no warranties are implied regarding the content of the suggested reading material or the content of the website(s) which can be accessed through this website. Traders Exchange Corp. shall not be liable in any way for losses or liability of any kind to any person resulting directly or indirectly through the use in any way by such person of the information referred to and/or use of the suggested reading material or the website(s), however such loss or liability occurs, and whether financial or otherwise. The pages and the opinions or information contained in the suggested reading material or these website(s) are the creation of outside parties and do not necessarily reflect the opinions or representations of Traders Exchange Corp.